Printable Saving Money Chart to Track Your Progress
Did you know that 78% of aspiring entrepreneurs fail in their first year simply because they run out of initial capital before their ideas can take off? Many people dream of building a lucrative side hustle or achieving total financial freedom, but they completely overlook the power of tracking the money they already have. If you want to successfully launch a work from home business, your first step isn’t finding investors; it is mastering your own cash flow. That is exactly where a saving money chart becomes your secret weapon.
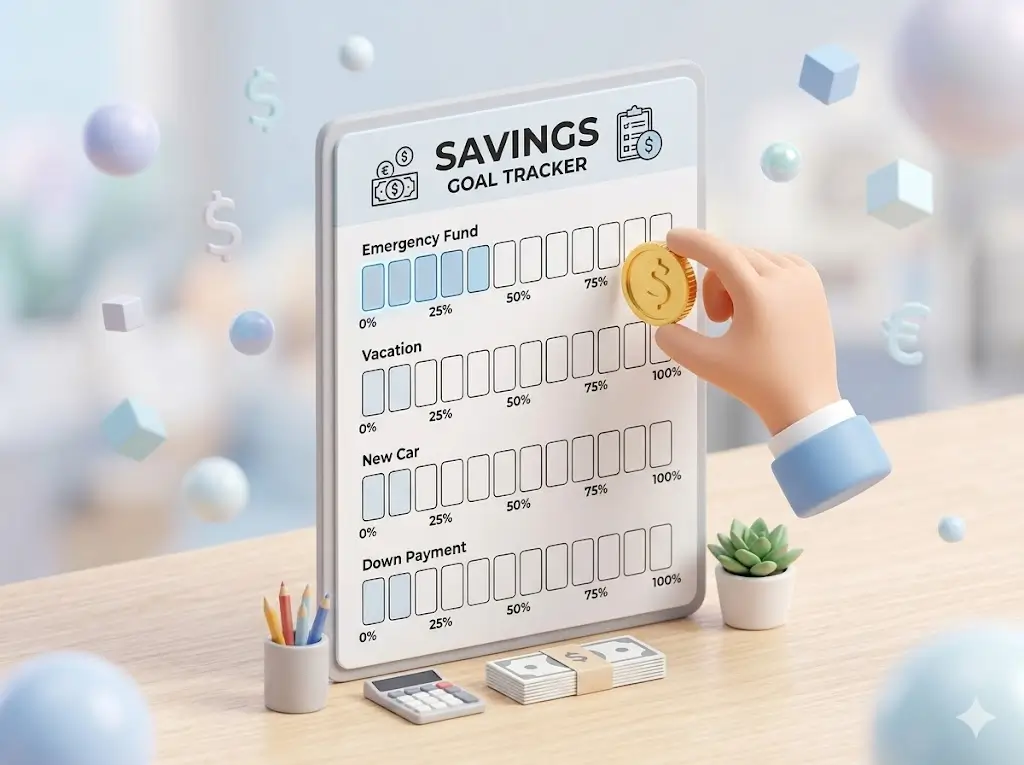
A printable saving money chart is a visual representation of your financial goals. By actively tracking your progress and coloring in milestones, you transform abstract numbers into a tangible game. This guide will show you exactly how to use a saving money chart to build the initial capital required to fund your digital income projects, scale your revenue streams, and ultimately take control of your financial destiny.
What You’ll Need to Get Started
Starting your savings journey doesn’t require an advanced degree in finance or expensive software. The barrier to entry is virtually non-existent, making this the perfect first step toward online earnings.
Required Tools & Resources:
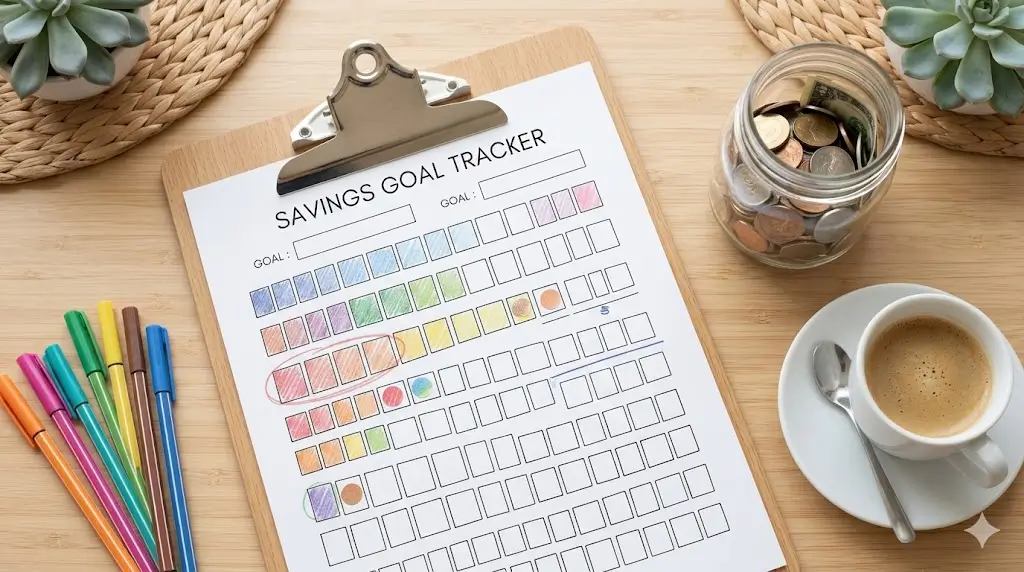
- A Saving Money Chart: A printable PDF template (like a 52-week challenge, a $1,000 emergency fund tracker, or a customizable goal chart).
- A Visual Marker: Highlighters, colored pens, or stickers to physically mark your progress.
- A Dedicated Savings Account: A High-Yield Savings Account (HYSA) separate from your daily checking to store the funds.
Initial Investment Breakdown:
- Financial Cost: $0 to $5. (You can download a free saving money chart online, or purchase a premium, aesthetically pleasing template from a digital creator for a few dollars).
- Mental Bandwidth: Low. The process is designed to be a fun, visual habit.
Skill Requirements:
- Basic consistency.
- Beginner-Friendly Alternative: If you struggle with physical paper, use a digital iPad planner or a simple spreadsheet to replicate the visual tracking experience.
Time Investment
Building wealth is a marathon, not a sprint. However, the time required to manage a visual tracker is incredibly minimal compared to traditional income methods.
- Setup Time Required: 15 to 20 minutes. This includes printing your saving money chart, defining your exact financial target, and taping it to your fridge or office wall.
- Daily/Weekly Time Commitment: 5 minutes per week. You only need a moment to transfer funds to your savings account and color in a block on your chart.
- Timeline to First Results: Most beginners see a massive psychological shift in 30 days and hit their first major financial milestones in 60-90 days with consistent effort.
- The ROI of Time: Spending 5 minutes a week tracking your money yields a guaranteed 100% return on the cash saved—capital you can then use to build passive income streams.
Step-by-Step Implementation Guide
Step 1: Define Your “Why” and Your Target
Before you print anything, you need a highly specific goal. Are you saving $500 to buy website hosting and premium themes for a new blog? Are you saving $2,000 to buy e-commerce inventory?
- Pro Tip: Write this exact goal at the top of your saving money chart. Connecting the chart to your future monetization strategies keeps you motivated when you want to make an impulse purchase.
Step 2: Choose Your Saving Money Chart Format
Select a chart that matches your cash flow style.
- If you get paid weekly, a 52-week challenge chart is ideal.
- If you want to save randomly based on tips or side-gigs, a “color-by-number” savings jar chart works best.
Step 3: Find Your Personal Profit Margins
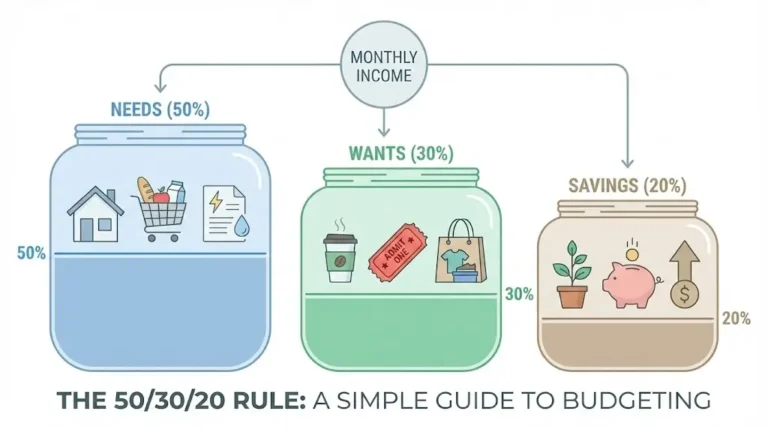
Treat your personal finances like a business. Your salary is your gross revenue; your living expenses are your overhead. The difference is your personal “profit margin.” Audit your subscriptions, pack your lunches, and dedicate that recovered profit directly to your savings goal.
Step 4: Automate the Transfer, Manually Track the Win
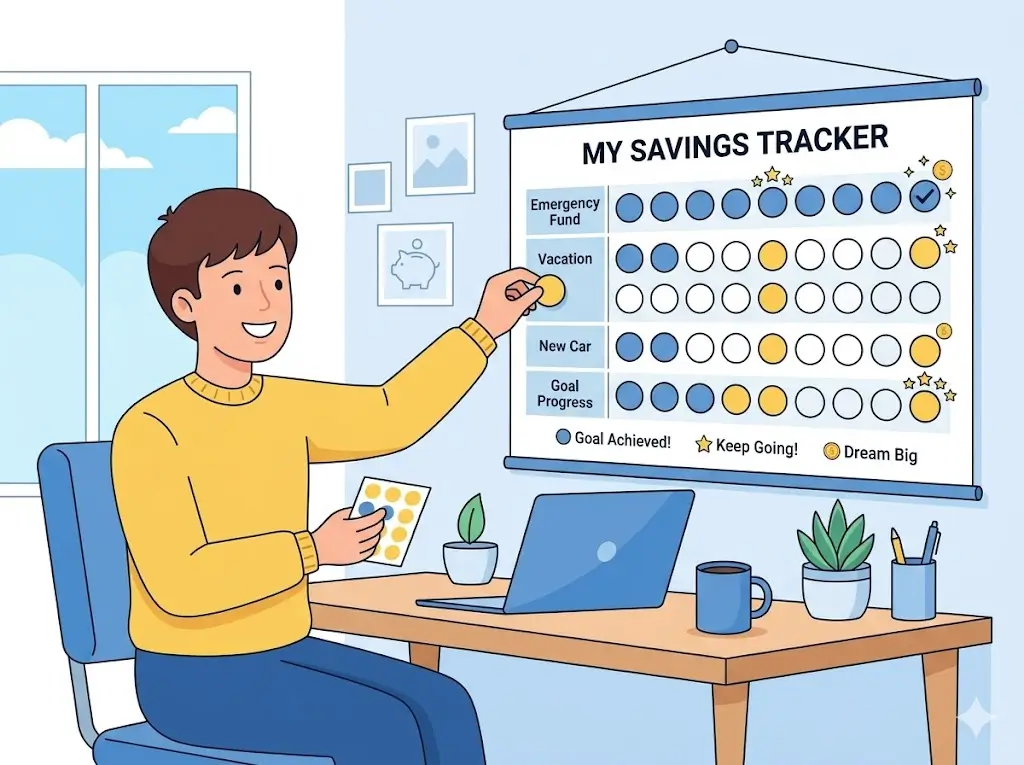
Set up an automatic bank transfer so the money leaves your checking account without you thinking about it. However, always color in your saving money chart manually. The physical act of coloring a milestone releases dopamine, gamifying the wealth-building process.
Step 5: Protect the Funds
Do not link a debit card to the account holding these funds. This money is your seed capital for future revenue streams. Keep it out of sight digitally, but keep the chart highly visible physically.
📊 Chart Your Progress Calculator
How much could YOU save? Enter your numbers below to see how fast you can fill your chart and fund your dream side hustle.
Your Chart is Ready! 🎨
Enter your info below to unlock your personalized timeline and discover exactly what kind of online business you can fund with your savings.
Awesome, ! Here is your game plan:
0 Weeks
By coloring in every week!
Once you hit your goal, here is the income potential you can unlock based on the article:
Business Level
Description
Income Potential & Earnings Breakdown
While a saving money chart technically retains money rather than earning it, this retained capital is the foundation of your income potential. Here is how saved capital translates into earning power:
| Capital Saved via Chart | Business Application | Realistic Online Earnings Potential |
|---|---|---|
| $100 - $300 | Domain name, basic web hosting, Canva Pro | $50 - $500/month (Blogging, Freelance) |
| **$500 - $1,000** | Ad spend, software tools, LLC formation | $500 - $2,000/month (Affiliate Marketing) |
| **$2,000 - $5,000+** | E-commerce inventory, custom development | $2,000 - $10,000+/month (E-commerce, SaaS) |
Case Study: Mark wanted to start a dropshipping business but had zero capital. He printed a "$1,000 Saving Money Chart" and taped it to his bathroom mirror. By cutting out takeout and gaming subscriptions, he colored in his chart over 4 months. He used that $1,000 to run optimized Facebook ads for his store, eventually building a revenue stream that nets $3,500 in monthly profit.
Alternative Methods & Variations
Depending on your psychological money blocks, you might prefer these niche-specific variations of the standard saving money chart:
- The 100 Envelope Challenge: You write numbers 1 to 100 on physical envelopes. Each week, you draw an envelope and save that exact dollar amount. It’s highly randomized and turns saving into a lottery-style game.
- Digital Dashboards: For the tech-savvy, tools like Notion allow you to create digital progress bars that act as a modern saving money chart.
- Scaling Strategies: Combine your savings chart with a gig-economy side hustle (like driving for Uber or freelancing on Fiverr). Dedicate 100% of your side hustle income specifically to filling in your chart faster.
Best Practices & Optimization Tips
To guarantee you actually finish your saving money chart, use these efficiency hacks:
- High Visibility: Never hide your chart in a drawer. Put it on your refrigerator, bathroom mirror, or directly on your computer monitor.
- Micro-Milestones: Break large goals into micro-targets. Instead of one $5,000 chart, use five $1,000 charts. The frequent "wins" of completing a whole chart accelerate motivation.
- Community Accountability: Share pictures of your partially filled saving money chart on social media, or join Discord communities focused on financial independence.
- Accelerate with Windfalls: Apply any unexpected cash—like tax refunds, birthday money, or cash-back rewards—directly to your chart to leapfrog weeks ahead.
Common Mistakes to Avoid
Saving money requires behavioral change, which is notoriously difficult. Watch out for these common pitfalls:
- Setting Unrealistic Goals: Trying to save $1,000 in a month when your total disposable income is $200. This leads to burnout and a 90% abandonment rate within the first three weeks.
- Forgetting the "Why": Saving just for the sake of having cash is boring. If you don't connect your saving money chart to a larger goal (like funding passive income projects or a dream vacation), you will lose interest.
- Punishing Yourself for Missed Weeks: If an emergency happens and you can't color in a box one week, do not throw the chart away. Pause, handle the emergency, and resume the following week. Consistency over time beats perfection.
Long-Term Sustainability & Growth
Completing your first saving money chart is a monumental victory, but it is only the beginning of your financial journey.
- Reinvestment Strategies: Once your chart is full, deploy that capital. Don't let it rot in a low-interest account. Invest it into assets that generate passive income, such as dividend-yielding index funds, or use it to launch your online business.
- Automation Opportunities: As your income grows from your new digital revenue streams, graduate from manual charts to fully automated saving and investing using robo-advisors.
- Future-Proofing: Make the visual tracking habit a lifelong practice. Even multi-millionaires track their net worth visually. As your income scales, your charts simply evolve from tracking hundreds of dollars to tracking thousands.
Conclusion
A printable saving money chart is much more than a piece of paper; it is a psychological tool that bridges the gap between where you are financially and where you want to be. By visualizing your progress, you turn everyday frugality into the seed capital necessary to build lasting passive income and true financial freedom.
Ready to start your journey? Drop a comment below telling us what goal you are saving for! Make sure to subscribe for weekly monetization strategies, download our free starter saving money chart, and share your progress in our community!
FAQs
How much money can I realistically save using a visual chart?
The amount depends on the specific chart you choose and your personal profit margins. Common charts target $1,000, $5,000, or the popular 52-week challenge which yields $1,378 in a year.
Do I need prior experience to use a saving money chart?
Absolutely not. These charts are specifically designed for beginners who struggle with complex budgeting software. If you can use a highlighter, you can use this method.
What's the initial investment to start this method?
The investment is virtually zero. You can draw your own chart on a piece of scrap paper or download hundreds of free printable templates online.
How long until I see results?
You will see visual results the very first day you color in a box! Financially, most people feel a significant reduction in money-related stress within 30 to 60 days of consistent tracking.
Is this method still working in 2026?
Yes. Despite the rise of digital banking apps, the psychology of human behavior hasn't changed. The tactile, physical act of coloring in a chart provides a dopamine hit that digital apps often fail to replicate.
What are the risks involved?
There is zero financial risk in tracking your savings. The only risk is keeping large amounts of physical cash in your house (if using the envelope method) rather than depositing it into a secure, FDIC-insured bank account.